Cloud, Performance Engineering, Performance Optimization
How To Choose a Performance Testing Platform: The Ultimate Guide
- By Moviri Team
28 Jan
Comparing Testing Tools: NeoLoad vs JMeter vs LoadRunner vs Gatling vs k6 vs Locust
In this article, we are going to explain which are the key factors when selecting a performance testing platform. We are also going to offer some insights regarding your possible choices. At the end of the article, you will find a handy performance testing software comparison table.
Performance testing is a complex and ever-evolving IT domain and a platform should incorporate capabilities spanning a range of criteria. We are going to illustrate the ones you should prioritize in your evaluation.
As an important disclaimer, the performance testing tools that we discuss and that we have compared are far from representing an exhaustive list. It is a selected sample of the performance testing platforms which we usually find at, and use more often with, our enterprise customer IT organizations.
Protocol coverage
Depending on the protocols that are going to be tested (e.g. HTTP, SAP, GUI, Citrix, etc.), there are different options on the market. Some of the performance testing tools focus more on straight HTTP/S protocol, while others are certified on specific ones such as SAP.
HTTP/S protocol is the most widely used and the one that is supported by the widest range of tools and platforms. What really makes the difference is the ability of the platform to support and automate testing script generation. HTTP/S scripting requires a lot of manual work, if not assisted by some sort of autocorrelation engine, which is typically provided by enterprise-grade platforms.
In addition to that, there are important differences depending on the target application. If we need to only test API requests, then an open-source solution such as JMeter can be more than adequate. If there are complex app navigational paths composed of a lot of passages between different pages or non-HTTP protocols (e.g. Citrix, SAP), relying on a tool like Tricentis NeoLoad or Micro Focus LoadRunner is a better bet.
When it comes to simulating real user behavior in complex web applications, browser-based protocols like TruClient in LoadRunner and RealBrowser in NeoLoad offer distinct advantages. These protocols allow for script generation that mimics actual user interactions within a web browser, providing a more accurate representation of user experience and system performance. Unlike HTTP/S scripting, these browser-based protocols can handle complex navigational paths and client-side scripts, making them ideal for testing applications with intricate user interfaces.
CI/CD readiness
Modern performance testing platforms have been natively designed to be integrated with continuous integration and delivery (CI/CD), while older ones are evolving to fill this gap.
This is a core feature since it’s required to effectively address the modern software development lifecycle and new paradigms like continuous integration and DevOps. The integration with such tools leads to building and delivering a streamlined process and an optimal end result.
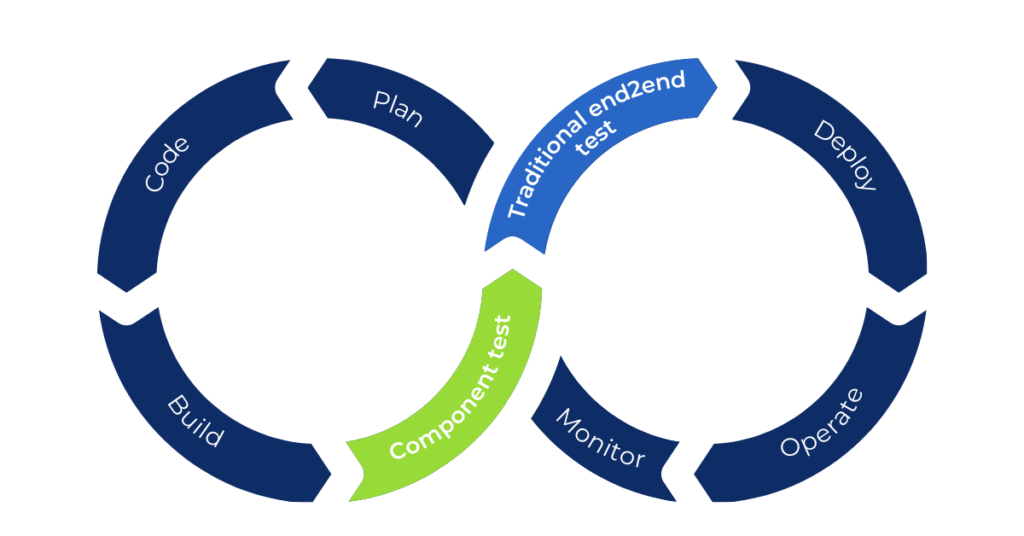
It is then critical to know whether a tool can support automation to enable you to create a testing process of core components separately, in the early development stages. That can be done also at each commit, to address promptly any issues that could have a greater impact down the line.
At the time of writing, JMeter, Tricentis Neoload, k6, and Gatling are the best choices when it comes to ease of setup, if you have to prioritize CI/CD readiness. Micro Focus LoadRunner can still be integrated with CI/CD, but you need to allocate some extra time on the setup phase and the analysis part.
Performance ecosystem integration
Depending on the coverage required from the testing practice, the integration with external tools can be a crucial point in tool selection. For example, the integration with observability platforms gives you the ability to massively expand your understanding of what is happening when a certain load is injected into the system and what are the main issues.
All performance testing tools return the basic metrics you can expect, such as response time, throughput, error rate, and so on. Most of the tools can also extract information from the SUT (i.e. system under test), such as:
- CPU consumption;
- Memory consumption;
- Network usage;
- Disk usage.
An observability platform adds to your analysis capabilities. It allows deeper visibility into single requests (traces) on each service and down to database queries.
The integration between the performance testing suite, the observability platform, and the development pipeline can also allow automated performance validation of the code, allowing you to test it before it reaches production and validate performance constraints.
Tricentis Neoload and Micro Focus LoadRunner have solid foundations to integrate themselves into a performance ecosystem, including raw metrics from hosts (e.g. Sitescope for Micro Focus LoadRunner) or application performance monitoring tools, such as Dynatrace. Tricentis Neoload also natively integrates with Gremlin, one of the most widely used chaos engineering platforms.
The other tools in our list do not have as strong an integration with the performance tooling ecosystem, but custom solutions are usually present.
Sidenote: AI-powered performance optimization
Today, a new breed of AI-driven optimization solutions are being introduced in the market that can be integrated with the performance ecosystem, such as, for example, Akamas. Once a user sets the optimization goal, Akamas automatically executes performance tests to find the best configuration, achieving the optimal performance and cost from the target application or service. To do this, it needs to integrate with performance testing and telemetry tools as a starting point.
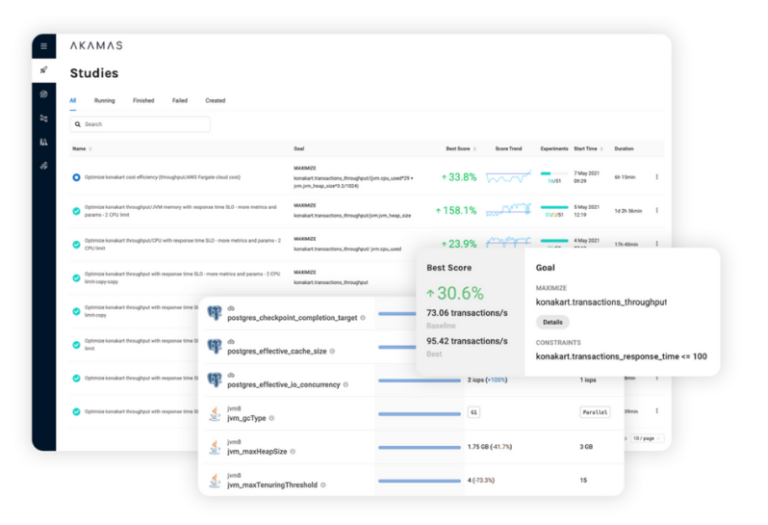
If you are planning to introduce an optimization tool like Akamas in your ecosystem, you should consider choosing a performance testing tool that is natively integrated with your optimization tool of choice. For example, at the time of this writing, Tricentis Neoload, LoadRunner and JMeter are all natively integrated with Akamas. This way you can re-use the performance tests done by NeoLoad for example, and then optimize the application finding the best full-stack configuration for your environment.
Cloud readiness
Most enterprise performance testing solutions are now providing, in different ways, cloud support.
In the past, if you wanted to create a test factory, the first thing to do was to provide a set of hosts to be used as controllers and load generators. Clearly, this represented an extra cost, since each host had to be maintained throughout versions and had to always be available, even when tests were idle.
Now some of the most advanced tools provide a set of hosts in the cloud in multiple locales around the world. It’s now the vendors themselves that manage these hosts, keeping them updated and always ready. When we need to launch a test, we can easily connect to cloud load generators and run it.
This means that you have a potentially infinite number of load generators to use, if the testing scenario requires the injection of large load amounts. Once the test is done, there are no hosts to be maintained, no hardware to be paid for.
Furthermore, some enterprise testing platforms, such as Tricentis Neoload Web or MicroFocus Storm Runner, also offer a web console where you can manage the tests and the host zones, browse the results and share them with other teams, or with your boss.
Scalability
Scalability is another important consideration in selecting a performance testing tool, not only for the testing platform itself, but also for the test farm.
Some of the tools, especially open-source ones, do not scale as easily or straightforwardly as others. This can be a significant disadvantage, especially if you already know that, at some point in the software lifecycle, you will have to launch very large tests.
Usually, highly scalable solutions, such as Micro Focus LoadRunner or Tricentis Neoload, are the ones that are easier to maintain both on SaaS and on-prem.
Learning curve
A tool that is easy to set up and configure can be easily handed over to developers, so that they can independently run small tests during the development stages of an application. This empowers them to identify and address many possible performance issues early, as soon as they appear. This helps avoid the massive compounding effect that small issues can have by the time an application reaches the stage of its final end-to-end performance test. This complex, typically large, final test is usually done only a few days before the release in production, and if it does not go well it could postpone or block it.
k6, now part of Grafana Labs, is the best choice if you need a quick load test on APIs. In fact, a k6 load test can be easily set up in just 10 minutes. This is not the case for enterprise solutions that tend to have a steeper learning curve.
Analysis and reporting
Open-source performance testing frameworks often fail to support the performance engineer in analyzing the outcomes of tests.
Drilling down into various charts and timeframes, being able to correlate end-to-end system metrics, comparing experiments on different configurations or software releases are critical jobs-to-be-done for performance engineers. Today, advanced analysis capabilities built into your performance testing tool are a necessity.
Despite the generalized lack of proprietary analytics capabilities, most modern tools can be easily integrated with a variety of dashboarding platforms, such as Grafana or Tableau. For popular testing frameworks, there are many well-designed dashboards that are already publicly available.
Micro Focus LoadRunner and Tricentis Neoload have a dedicated tool designed, specifically for analysis and reporting.

Open source vs enterprise
As in almost every IT domain, the choice between open source vs commercial software is also important in selecting a performance testing tool. The type of load you need to inject can definitely lead you to prefer one path over the other.
While considering the open-source option and reviewing enterprise tools, the license model can hugely affect your choice. Typically, licenses are based on the number of Virtual Users (VU) you need to inject, but there are different options.
Some vendors use a subscription licensing model: you acquire a number n of VUs for a specified period (e.g. one year). Each time you launch a test, all n VUs will be available to you.
Others use VUD (Virtual Users Hours) as a metric: you buy a basket of VUs and each one “lives” for one hour from the moment it’s used the first time. This means that if you already know that you will need x tests and for each one at most y virtual users, you will need at least x*y VUs.
Team collaboration
If, in your organization, a dedicated testing team is responsible to validates continuously all or most of the applications, then you need a tool with a centralized platform, with important collaborative features to manage testing schedules, resources reservations (VUs, load generators, controllers …), version controls, result sharing, concurrent testing.
With an enterprise tool, such as Tricentis Neoload or Micro Focus LoadRunner, that enables you to have such control, you can smartly manage your entire testing practice, avoiding overlapping tests that could invalidate the results. You can also easily reuse scripts or monitoring configurations created by other team members, accelerating the overall process. Also, having a platform to easily share the results across the organization gives more visibility to the results.
Support and community
If the previous points are clearly focused on enterprise solutions, for open-source ones it’s really important to have an active community constantly evolving and supporting the tool. This means that the solution is always enhanced and that plugins for specific needs can be readily found.
For example, JMeter is an open-source tool that allows you to run basic performance tests with few clicks and basic functionalities. But, what if you need to randomize the parameters? You have to download a plugin that, fortunately, someone already wrote for you. This is true of hundreds of possible tasks and capabilities. So, while an enterprise solution affords you a large number of capabilities, a well-run open-source project, with a thriving developer community behind it, can also be a perfectly viable option, lest you want to “reinvent the wheel” also for some basic features.
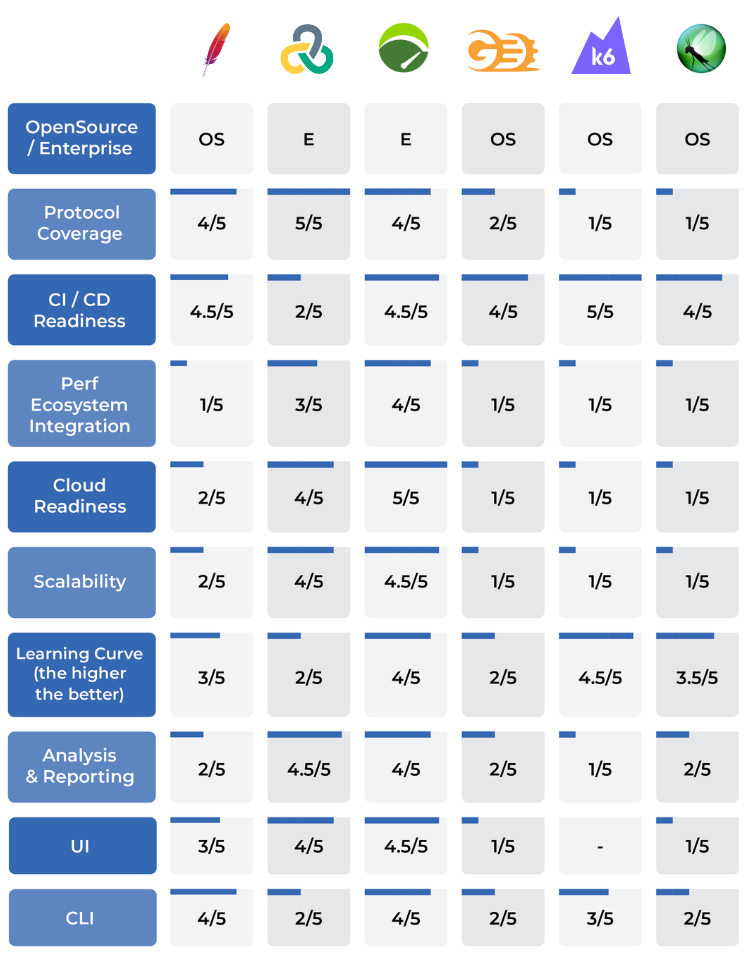
Comparison table
These are the most important factors that, in our experience, large organizations should consider before choosing a performance testing platform. You can also check our handy comparison table for quick reference.
Performance engineering solutions
Discover our services and solutions:
- Peak demand events
- Kubernetes & microservices
- Agile, DevOps & CI/CD automation
- AI-powered performance engineering
- and more…

Categories
- Akamas
- Analytics
- Announcements
- Arduino
- Big Data
- Capacity Management
- Cleafy
- Cloud
- Conferences
- ContentWise
- Corporate
- Cybersecurity
- Data Science
- Digital Optimization
- Digital Performance Management
- Fashion
- IoT
- IT Governance and Strategy
- IT Operations Management
- Life at Moviri
- Machine Learning
- Moviri
- News
- Operational Intelligence
- Partners
- Performance Engineering
- Performance Optimization
- Tech Tips
- Virtualization
Stay up to date
© 2022 Moviri S.p.A.
Via Schiaffino 11
20158 Milano, Italy
P. IVA IT13187610152