30 Nov
Many Capacity Managers face a common pain:
Our existing Capacity Planning reports are full of information but nobody outside the Capacity Management team is able to understand them.
We learned a few key factors that make a “Capacity Planning report” (a Capacity Plan) effective.
1. Set the scenario and share assumptions
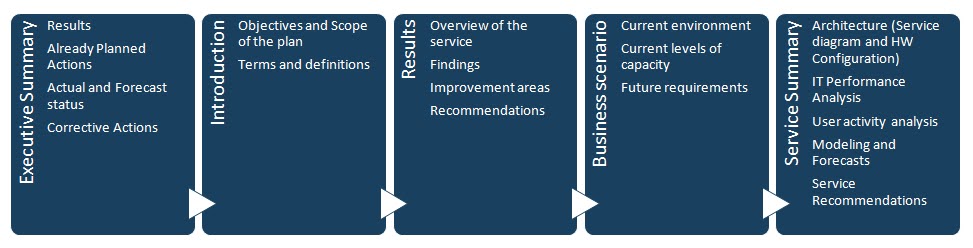
- Not everybody reads your report every day: make sure you clearly introduce it with an executive summary (most people won’t go beyond that)
- Remember to clearly state hypotheses, assumptions and other relevant information
2. Minimize information and focus on bottlenecks
- Aggregate homogeneous resources into clusters: if you have 25 balanced web servers they can be represented as one single aggregate view
- Use heat maps to reduce the footprint
- Focus on resources that are either consuming the most (“Top 10 systems by Memory utilization”) or with the least available capacity (“10 SAN boxes closest to saturation”); these are almost for sure going to be your bottlenecks
3. Translate into business-like terms
Whether reporting about capacity of an IT infrastructure silo (Midrange machines, Network devices, Application Servers, etc.) or about the capacity of a service (Mobile banking, Web Portals, Mail system), the reader is probably looking for these answers:
- How many users are we able to sustain?
- How many transactions can we process on a (hourly, daily, monthly, peak) basis?
- How much can we grow before we need to increase resources?
The best way to translate your data (CPU or Memory Utilization, disk space, network bandwidth usage, number of transactions, online sessions, etc.) is correlation: everyone understands “We are currently able to sustain 1500 visits an hour” while “The peak CPU Utilization has been 76%” is too technical.
This is how:
- start analyzing your data by looking at which metric is well correlated with another (for example by using scatter plots)
- clean and filter your data to get rid of numerical outliers (for example consider only working hours 9AM-5PM so that the nightly backup is not interfering)
- keep correlating until all metrics talk a common language (for example CPU utilization of the web server cluster is well correlated to the number of web hits, which is in turn well correlated to the number of visits to your web site)
4. Statistics helps
Wipe off some dust from your college books about statistics or read specific articles like “Statistics for the Performance Analyst”. Learn to reduce as much as possible the quantity of data you display by applying the correct statistical function (for example average of CPU Utilization, 90th percentile of Response Times, standard deviation of Jitter etc).
5. Data Visualization matters
The profile of a Capacity Manager must include strong communication skills and this applies to reports too: not only quality of information but also quality of display. Create a check list based on tips found on data visualization and reporting websites such as Mike tips list and Reporting best practices.
Comments are closed.
2 Comments
David Collier-Brown
You’re right on target with 3, but you may want to work almost entirely in time and dollars. Build your model using response time as the crttical variable, and find the load where the curve turns up (and up is bad) and leaves like a homesick angel. Then find the dollars it costs your business when the response time exceeds 30 seconds and customers start defecting. Finally, report the costs it takes to capture those sales back.
Andrea Titone
David, you are describing the most complete and effective “Capacity Plannig” report I can imagine. I wish I could do that one day. Unfortunately information on dollars is not so easily obtainable. It looks like customers consider this kind of information more confidential than the other and don’t realize how much added value would give to their reports.