24 Mar
Moviri presented Filter Based Reporting with TrueSight Capacity Optimization, at BMC Days Chicago, as part of the Actionable Intelligence Series. An introduction to advanced tools and techniques we can help you leverage to deliver additional value from existing data.
The thesis statement was essentially “is there an alternative to Quick Reports and Domain Based Reports? Something that was quick to change the objects that were reported on, while still being formatted appropriately to reveal actionable intelligence?”
We put on our thinking caps and find the answer is yes, with Filter Based Reporting.
What is “Filter Based Reporting”?
Filter Based Reporting is reporting where the chart contents and formatting have been developed with a particular objective in mind, then the objects contained in the report is chosen at report time by being defined in a filter.
This allows for the best of quick reports and domain-based reporting. The charts are formatted as desired to make quick actionable intelligence determinations AND the objects are chosen just in time.
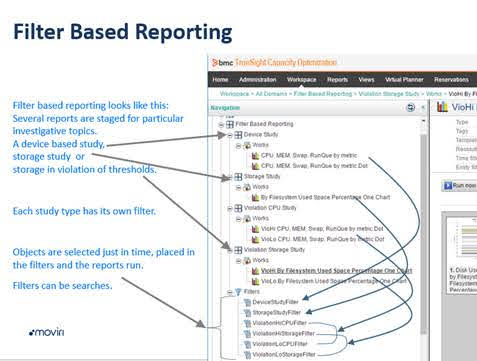
Several reports are staged for particular investigative topics. Such as a device based study, or storage study or storage in violation of thresholds study.
Each study type has its own filter.
Objects are selected just in time, placed in the filters and the reports run. The filter can be based on searches, even complex searches.
In this example, there are only a few charts but there is no limit. One filter drives a whole series of charts.
So let’s look in detail how this works.
Device study, the first section, has a couple of charts. Those charts are driven by the filter DeviceStudyFilter. To use this, set the filter, then run the charts.
Storage study, the next section, has a chart. That chart is driven by the StorageStudyFilter. Again set the filter, then run the chart.
The last two sections, each report has its own filter. They just got mixed up alphabetically. Anyway same idea, set the filter, run the chart.
Filters are search strings that can be tested on the search screen.
A few filter examples:
(type:sys –type:object)
(+(tag:AIX AND sys:p* NOT sys:*@*) –type:object
(((sys:*app01 OR sys:*app02) AND tag:Unix) –type:object)
The middle filter says Include everything tagged AIX, and are systems that starts with a p, which is probably production; but NOT systems that have an @ in the name. Also excluded anything that is a type ‘object’, which are reports.
Filters can be quite complex and can be combined. The result is a set of charts that are designed to show actionable intelligence quickly, cleanly, and with a specific target list.
A variation on this method is to use one filter to get an initial list of devices, then based on a criteria of that first list, generate a more targeted list. This could drive a separate set of reports and can be repeated to provide an ever more targeted list.
There are a number methods to implement these tools and techniques to reveal actionable intelligence.
Call Moviri and let us help you use this, and a host of other tools and techniques.
Available References:
https://www.moviri.com/download/Filter_Based_Reporting_with_TSCO_handout.pdf
https://www.youtube.com/user/BMCdocs/search?query=capacity
https://communities.bmc.com/community/bmcdn/capacity_management