Capacity Management, Performance Engineering
Demystifying Oracle Database Capacity Management With Workload Characterization
- By Stefano Doni
11 Feb

Going from simple resource consumption to business KPIs models, by leveraging database workload.
In a nutshell, Capacity Management is all about modeling an IT system (i.e. applications and infrastructure) so that we can answer business questions such as:
- how much business growth can my current system support? (residual capacity)
- where and how should I focus investments (savings) to increase (optimize) my capacity?
When facing typical three-tier enterprise applications, creating accurate models is increasingly difficult as we move from the front-end layer to the back-end.
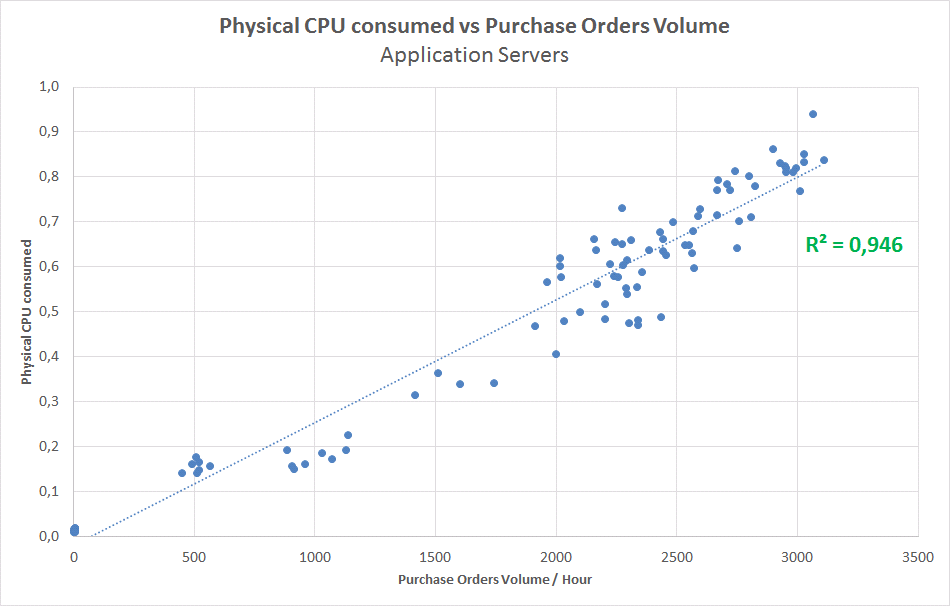
Front-ends (i.e. web servers) and Mid-ends (i.e. application servers) can be modeled with relative ease: their resource consumption is typically driven by user activity in business-related terms (i.e. business transactions per hour, user visits per hour etc). The chart below shows a typical linear regression model for such a system: the application servers CPU shows a good linear relationship with the volume of purchase orders passing through the application. The high correlation index (R-squared value next to 1) is a statistical indication that orders volume explains remarkably well the pattern of CPU utilization.

The problem: how to model databases?
When you deal with the back-end (i.e. database) component of an application, things are not as straightforward. Databases are typically difficult to understand and model as they are inherently shared and their resources pulled in several directions:
- by multiple functions within the same application: the same database is typically used for both online transactions, background batches, business reporting, etc.
- by multiple applications accessing the same database: quite often a single database is accessed by multiple applications at the same time, for different purposes
- by infrastructure consolidation: a single server might run multiple database instances
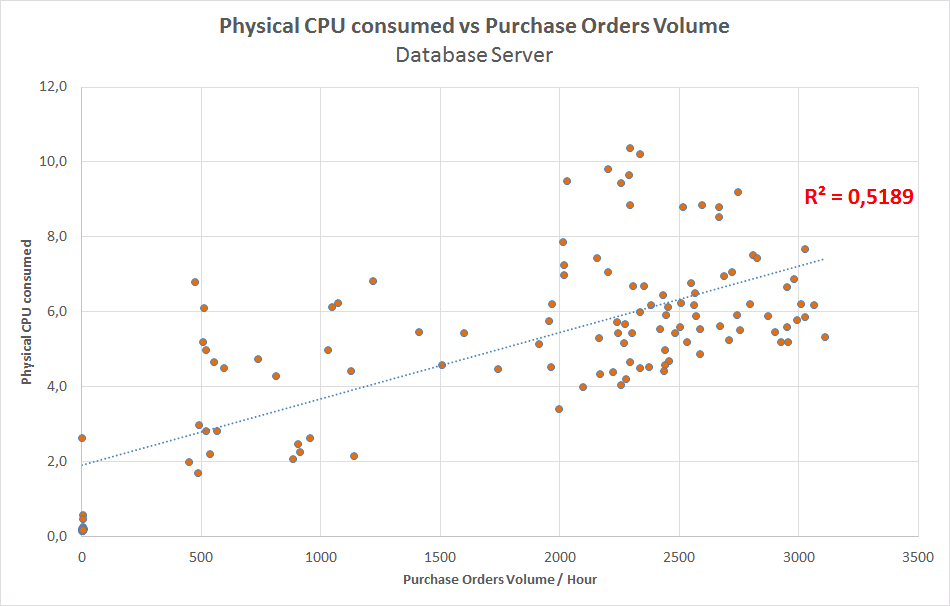
The next chart shows a typical relations among the total CPU consumption of a shared database server vs. the business volume of one application. This model is evidently quite poor: a quick visual test shows that the majority of the samples do not lie on or close to the regression line. From a statistical standpoint, the R-squared value of 0.52 is well below normally acceptable levels (commonly used thresholds are 0,8 or 0,9).

The end result is: simple resource consumption vs. business KPIs models do not work for databases. This is unfortunate as databases are usually the most critical application components and the ones customers are most interested in properly and efficiently managing from a capacity standpoint.
The solution: “characterize” the database work
I will now show you a methodology that we have developed and used to solve challenging database capacity management projects for our customers. The solution lies in a better characterization of the workload the database is supporting. In other words, we need to identify the different sources of work placing a demand on the database (e.g. workload classes) and measure their impact in terms of resources consumption (e.g. their service demands).
If the database is accessed by different applications (or functions), we need to measure the resource consumption of each of them (e.g. CPU used by application A and B, IO requests issued by online and batch transactions and so on). Once we have that specific data, we are in a much better position to create capacity models correlating the specific workload source (i.e. online activity) and the corresponding workload intensity (i.e. purchased orders per hour).
That’s the theory, but how can we do it in practice? Keep reading and you will learn how we can take advantage of Oracle database metrics to accomplish this goal!
Characterizing Oracle databases work using AWR/ASH views
Starting from release 10, Oracle has added a considerable amount of diagnostic information into the DBMS engine. It turns out that this same information is very helpful also from the capacity management perspective.
It is possible to extract CPU and I/O resource consumption by instance, schema (database user), machine or even application module/action/client id (Module/action/client id information is available provided that the application developer has properly instrumented it. See for example: http://docs.oracle.com/cd/B19306_01/appdev.102/b14258/d_appinf.htm ).
Oracle tracks resource consumption on a variety of ways. The most important ones, from the capacity management perspectives are: per session and per SQL statement basis. The former metrics can be retrieved from V$ACTIVE_SESSION_HISTORY, the latter from V$SQLSTATS. The corresponding DBA_HIST_<VIEW> can be queried for more historical samples.
The idea is to:
- identify how to isolate the application workload we are interested in (i.e. a specific user the application is using, or machine from which it is connecting)
- aggregate the session (SQL) based resource consumption to form the total resource consumption of the application.
How to do it in practice?
II’ll show you how Oracle work of an instance can be broken down by the application accessing it using session metrics.
In my experience per-session metrics proved to be more accurate than per-SQL statement metrics. Although the latter metrics measure actual SQL resource consumption (no sampling), the drawback is that they might not track all the relevant SQL statements that the database executed. Indeed, SQL statements might go out of library cache and therefore not being counted in AWR views and reports! See for example: http://jonathanlewis.wordpress.com/2013/03/29/missing-sql/
Step 1 is a function of how the application connects to the database. In this example, a single instance database was being accessed by different applications each using a specific user.
Step 2 is more interesting. How can we aggregate the application sessions to get the total number of CPU consumed? The Oracle Active Session History view samples session states every second. A possible approach is to:
- count the number of sessions that are ‘ON CPU’ and assign them a 1-second of CPU time
- sum all the CPU times within the desired time window (i.e. one hour), getting the total CPU busy time in seconds
It is important to note that this is a statistical measure of CPU consumption and therefore might not be 100% accurate. Always double check totals with resource consumption from other data sources known to be correct (i.e. monitoring agents or the operating system).
An example query that does this calculations can be found here:
SELECT TO_CHAR(sample_time, 'yyyy/mm/dd HH24') as sample_time, username,
   round(sum(DECODE(session_state,'ON CPU',
DECODE(session_type,'BACKGROUND',0,1),0))/60/60*10,2) AS cpu_secs
FROM DBA_HIST_ACTIVE_SESS_HISTORY a, dba_users b
WHERE sample_time > sysdate - 7
   and a.user_id=b.user_id
GROUP BY TO_CHAR(sample_time, 'yyyy/mm/dd HH24'), username
   order by 1,2
Results
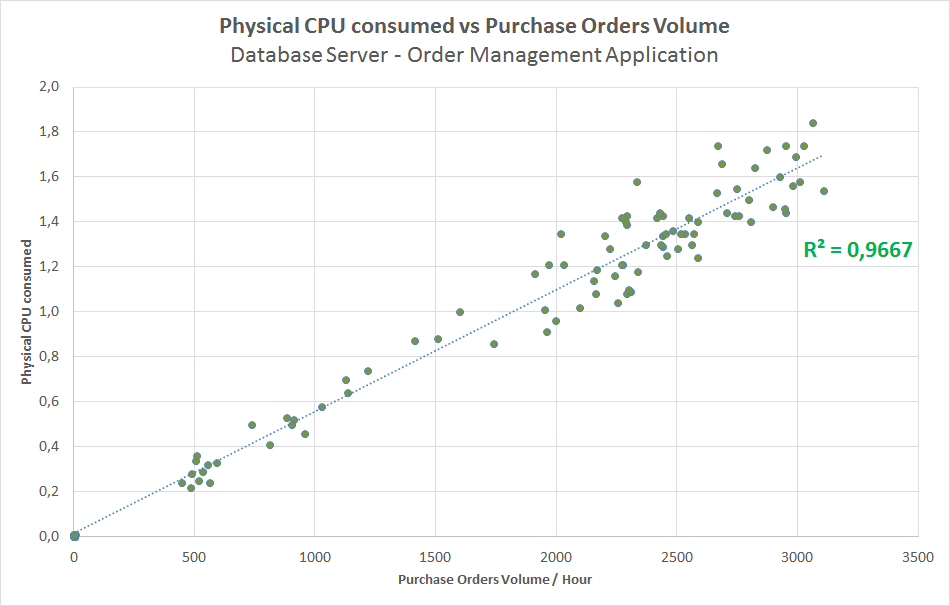
By using the above outlined methodology, I have isolated the database CPU consumption caused by the work placed by a specific application I was interested in (for example, Order Management). The next chart shows the relation among the physical CPU consumption of the database (caused by our selected application) vs the business volume of the selected application. The model now works great!

I hope you now agree with me that workload characterization is an essential step in capacity management. If properly conducted, it can provide you with remarkably good models when they are most needed!
Comments are closed.
Categories
- Akamas
- Analytics
- Announcements
- Arduino
- Big Data
- Capacity Management
- Cleafy
- Cloud
- Conferences
- ContentWise
- Corporate
- Cybersecurity
- Data Science
- Digital Optimization
- Digital Performance Management
- Fashion
- IoT
- IT Governance and Strategy
- IT Operations Management
- Life at Moviri
- Machine Learning
- Moviri
- News
- Operational Intelligence
- Partners
- Performance Engineering
- Performance Optimization
- Tech Tips
- Virtualization
Stay up to date

© 2022 Moviri S.p.A.
Via Schiaffino 11
20158 Milano, Italy
P. IVA IT13187610152
2 Comments
Larry Kayser
Just a thought – I do agree this is an essentional step but would add that while utilization can be modeled it is just part of the solution. I is worth mentioning that similar correlation analysis should be done on each ctricial resource to look for hidden gotcha’s. I used to generate a number of correlations daily to help expidite the detection of hidden problems. So easy to just look at CPU and miss as example an IO delay.
Also Service is another major factor and high utilization does not equate to bad service and visa versa.
Thanks and looking forward to more. The coding examples are a very nice touch and often never mentioned.
Renato Bonomini
We took Stefano’s work to the Regional Connecticut CMG meeting and there was much interest about this insightful analysis of Oracle workloads.
If you are interested, the slide set is published here: http://www.slideshare.net/RenatoBonomini/ccmg-movirioracleworkloadcharacterization