About the Company
This case study refers to one of our main customers, an Italian financial payment technology leader that offers a variety of services for consumer and commercial banking customers: Issuing, Merchant Services, ATM Management, Interbank Corporate Banking, Clearing & Settlement. We don’t quote the customer’s name to protect the confidentiality of the company.
The Challenge
The Customer’s systems process millions of transactions per day, across a variety of channels and multi-step authorization processes, which require continuous supervision to mitigate risk and detect threats.
The Customer asked the Moviri Analytics team to develop an anomaly detection system, operating on transactions in near real-time, designed to intercept unexpected increases or decreases in transaction volume at various channel levels, so as to quickly identify and fix possible faults. The complexity of the challenge was compounded by the heterogeneity and sheer volume of the data that had to be monitored.
Strategy and Solution
To tackle the challenges involved in this project, Moviri needed something light and performant. First, the team reviewed literature and machine learning algorithms, evaluating methods ranging from clustering to statistical analysis, eventually focusing on a Seasonal Extreme Studentized Deviate (SESD) test. SESD is an unsupervised machine learning method, which, since it does not require data labeling, was ideally suited for this type of implementation case.
Approach:
1) Aggregation
A preliminary aggregation step was required to extract all the time series to be fed to the algorithm. For each analyzed time series, we were able to determine whether the number of transactions that occurred in any 10-minute buckets was to be considered anomalous or not. The low-granularity data aggregation was performed incrementally, meaning that, every 10 minutes, a new time-bucket was created and written back into our data source, ready to be consumed by SESD.
2) Detection
As soon as the aggregation step was completed, SESD was run parallelly on all the time series and the results were returned in output, highlighting when and where any anomalies occurred.
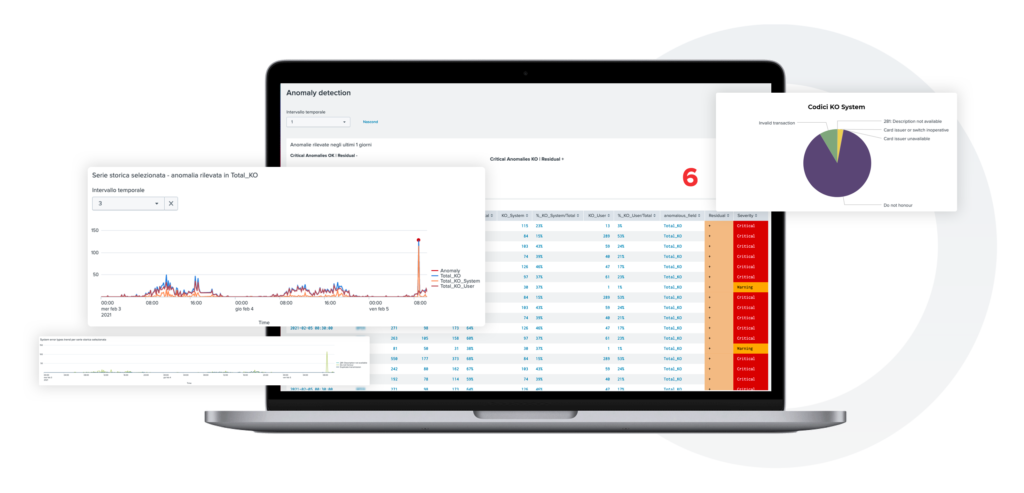
3) Reporting
Once the output was generated by SESD, it was displayed in a dashboard that summarizes the algorithm’s findings of the last few days, including all detected anomalies, sorted by priority. Users could investigate each time series separately and, for instance, understand whether there are any problems with a specific branch, application, or system.
It is important to note that past data were unlabeled, so the problem was unsupervised. In other words, we did not know in advance when and where anomalies occurred. This means that there was no clear distinction between a training set and a validation set to test our model. Still, we were able to precisely evaluate the amount of false positives/negatives through several runs of quality assurance tests with experts in finance and banking, the final users of the system. During these sessions, the Customer shared major anomalies that had been manually discovered, all of which were indeed independently detected by the system built by Moviri.
Technology:
Splunk, ML Toolkit, ad-hoc machine learning algorithms.
Results and Benefits
1.000.000
Transactions monitored every hour
600
Anomalies automatically detected every day
10 mins
Anomaly detection frequency on 100K transactions
100+
Daily person-hours saved to detect anomalies
Guide
Anomaly Detection with Machine Learning
In this paper, we offer a practical, high-level blueprint that CTOs can follow to make sure anomaly detection systems fulfill their innovation and value-creation promise.
Find out more about the 9 key tasks that CTOs must fulfill to build an enterprise anomaly detection system.

© 2022 Moviri S.p.A.
Via Schiaffino 11
20158 Milano, Italy
P. IVA IT13187610152